
4Reports and Inquiry
Option 1Budget Analysis Report
This report is provided to present budget performance. Budget amounts are compared to actual amounts for each budget type, account, and fiscal year, and are reported in cumulative or net monthly amounts. The following processing steps accomplish this job.
- Step 1You can use this function to specify whether you want net or cumulative amounts to be printed on the Budget Analysis report.
The screen shown below allows you to enter parameters needed for the Budget Analysis report.
Report screen
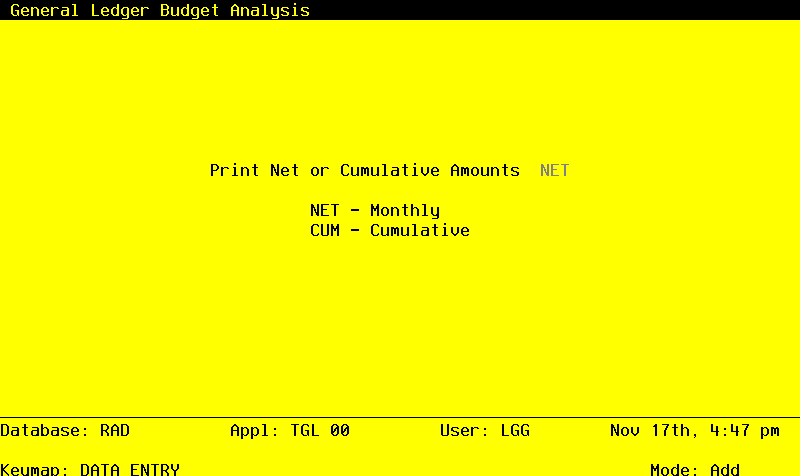
Data items for the preceding screen are described below:
- Print Net or Cumulative Amounts
Upper case, up to 3 characters Letters only Valid: NET, CUM Required Carries forward in ADD mode
Define the code that identifies the terms in which the balances are to be printed.
- NET
- Month-to-date net activity
- CUM
- Year-to-date cumulative amounts
Press ENTER to save the information on this screen.
- Step 2In preparation for performing a sort/selection process on the Budget Amounts information, this step provides you with a default sequencing of data records by Budget Type, Account, and Fiscal year, giving additional sort order choice by Account Component, with the option to change modifiable parameters at run time. Selection of data records is provided by Budget Type, Account, Account Component, and Fiscal Year, with the option to enter user-specified comparisons at run time.
- Step 3This disposition type is used for all standard General Ledger reports.
- Step 4According to previously specified criteria, this step actually performs the desired selection and/or sorting process.
- Step 5In order to print the Budget Analysis Report, this step formats the Budget Amounts information. The following data items are shown: Fiscal Year, SOY, Budget Compared to Actual, Month Descriptor, Monthly Balances, Monthly Amounts, EOY, Monthly Amount, and Monthly Net Amount. As appropriate, group headings appear whenever a change occurs in Account.
A sample output is shown below:
                                                      Expert Computing, Inc.
11/08/94 16:59                                                                                                     LGG Page:    1
                                                      Budget Analysis Report


                                                        NET MONTHLY TOTALS

              Actual           Budget      % of Budget                                 Actual           Budget      % of Budget
=================================================================================================================================


Budget Type FY89 Budget FY89 Operating Budget


Account 3010001001MA  Sales, Manufacturing

                                                         Fiscal Year  89
  SOY           0.00             0.00
                                                                           Dec     294,081.59-      333,333.33-           88.22
  Jun     404,744.38-      333,333.33-          121.42                     Jan     412,740.46-      333,333.33-          123.82
  Jul     417,700.15-      333,333.33-          125.31                     Feb     273,507.10-      333,333.34-           82.05
  Aug     346,774.40-      333,333.33-          104.03                     Mar     362,910.19-      333,333.34-          108.87
  Sep     355,911.28-      333,333.33-          106.77                     Apr     377,486.22-      333,333.34-          113.25
  Oct     420,149.51-      333,333.33-          126.04                     May     370,861.59-      333,333.34-          111.26
  Nov     290,440.98-      333,333.33-           87.13
                                                                           EOY           0.00             0.00             0.00


Account 3010001001WH  Sales, Wholesale

                                                         Fiscal Year  89
  SOY           0.00             0.00
                                                                           Dec     206,652.54-      200,000.00-          103.33
  Jun     255,325.08-      200,000.00-          127.66                     Jan     201,105.20-      200,000.00-          100.55
  Jul     253,667.02-      200,000.00-          126.83                     Feb     234,003.25-      200,000.00-          117.00
  Aug     235,878.76-      200,000.00-          117.94                     Mar     228,069.70-      200,000.00-          114.03
  Sep     230,528.71-      200,000.00-          115.26                     Apr     238,886.72-      200,000.00-          119.44
  Oct     210,676.51-      200,000.00-          105.34                     May     243,884.07-      200,000.00-          121.94
  Nov     199,757.45-      200,000.00-           99.88
                                                                           EOY           0.00             0.00             0.00


Account 3010002001MA  Sales, Canadian Manufacturing

                                                         Fiscal Year  89
  SOY           0.00             0.00
                                                                           Dec     171,171.30-      166,666.67-          102.70
  Jun     186,467.13-      166,666.67-          111.88                     Jan     168,505.05-      166,666.67-          101.10
  Jul     171,514.96-      166,666.67-          102.91                     Feb     146,402.38-      166,666.66-           87.84
  Aug     141,603.62-      166,666.67-           84.96                     Mar     172,412.86-      166,666.66-          103.45
  Sep     156,834.44-      166,666.67-           94.10                     Apr     174,496.86-      166,666.66-          104.70
  Oct     164,460.58-      166,666.67-           98.68                     May     193,811.50-      166,666.66-          116.29
  Nov     153,384.20-      166,666.67-           92.03
                                                                           EOY           0.00             0.00             0.00