APPX GUI ILF Debugger
Effective with Release 5.0.0, the ILF Debugger has been replaced with a new GUI ILF Debugger.
Overview
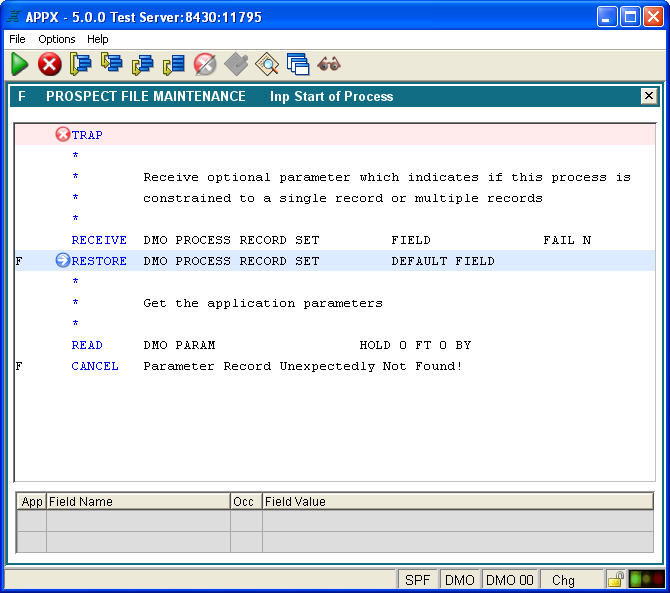
The GUI ILF Debugger is invoked automatically when ILF code is displayed at run time. ILF line(s) of code that are set for trapping will be marked with the red and white icon and the entire line will be have a pink background. The next ILF line to be executed is marked with a blue and white icon and the line will have a blue background. Traps may be set at run time by clicking on the desired line and then clicking on the Trap icon on the Toolbar.
Toolbar Buttons

Go - Resume normal execution.

Cancel - Abort process being debugged.

Single Step - Execute the current line and stop on the next line in the current routine.

Step Into - Execute a process or subroutine and stop on the first statement of the routine.

Step Return - Resume execution and stop on the next RETURN statement.

Step End - Resume execution of the current routine and stop on the last statement in the routine.

Toggle Trap - Enable/Disable a trap on the current statement.

Edit Values - Edit the value of the variables on the current statement.

Inspect/Edit Value - Inspect and/or edit the value of a specified variable

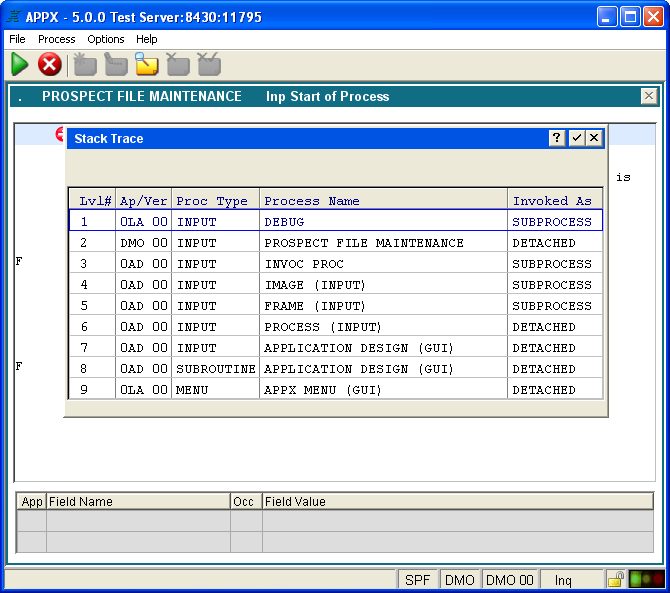
View Process Stack

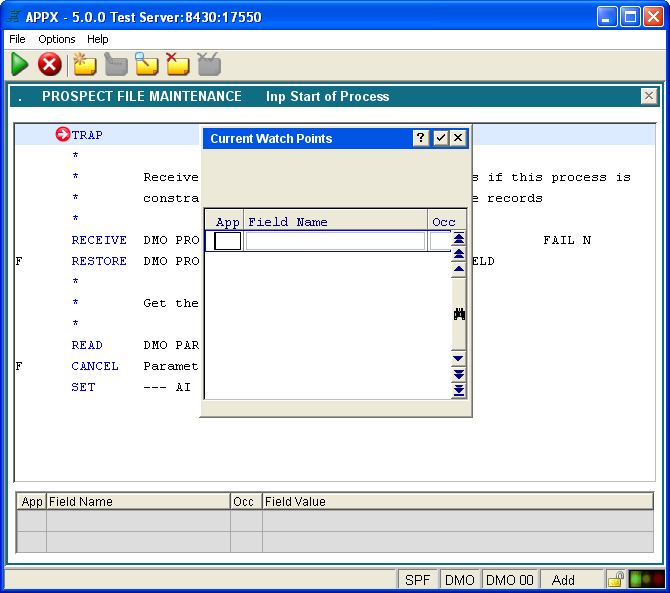
Watchpoint - Set or Clear watch points on individual variables
Main Debugger Window

Identifies an ILF commnad what has a stop point (trap) enabled.

Identifies the next ILF command line to execute.

Identifies the next ILF command line to exectute and indicates that the line has a stop point (trap) enabled
The Toolbar contains several new icons. The Green Arrow will jump out of the trapped event point . The Red X will cancel the process as always. Single step will execute the next sequential instruction, same a the Return key. The Step Into will follow a child process. Step Return takes you to the next Return statement. There is a red/gray icon you can use to set and remove a trap. F3 can still be used to set and un-set traps as well. The Edit values icon will allow the current field value(s) to be modified. Inspect/Edit will allow you to enter a field and see its contents. View Process Stack will display the current process stack showing the Ap/Ver, Proc Type, Process Name, and invocation share class. Watch Variable allow you enter a field name and Appx will indicate when the contents of that field change.
Scrolling the ILF Debugger using the up and down arrow keys is not permitted.
Watchpoints
Process Stack
Comments:
Read what other users have said about this page or add your own comments.
--
SteveFrizzell - 26 Sep 2008
