The APPX ILF debugger is a powerful debugging tool that enables the APPX application designer to examine field values and to observe how field values change as individual ILF statements are executed. The APPX ILF Debugger is invoked as the result of executing a TRAP statement when testing a process or as the result of encountering a runtime error such as a Numeric Overflow.
> >
The APPX ILF debugger is a powerful debugging tool that enables the APPX application designer to examine field values and to observe how field values change as individual ILF statements are executed. The APPX ILF Debugger is invoked as the result of executing a TRAP statement when testing a process or automatically as the result of encountering a runtime error such as a Numeric Overflow.
Main Debugger Window
Changed:
< <
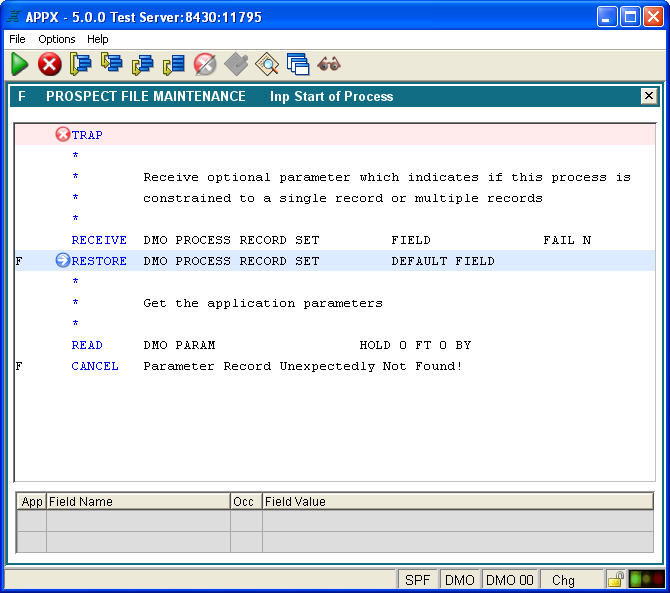
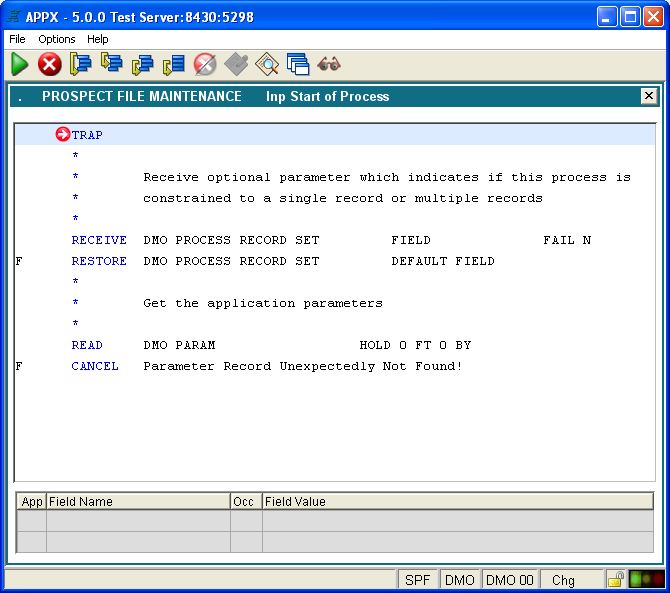
The main window of the ILF debugger displays the ILF statements which precede and follow the next line to be executed. The next ILF statement to execute is highlighted with a light blue background. If the ILF debugger is displayed as the result of encountering a TRAP statement, the next line to be executed will be the TRAP statement.
> >
The main window of the ILF debugger displays the ILF statements which precede and follow the next line to be executed. If the ILF debugger is displayed as the result of encountering a TRAP statement, the next line to be executed will be the TRAP statement. In the example below, the TRAP statement is highlighted with a light blue background. The white arrow in the red circle points to the statement to further hightlight it.
Changed:
< <
The ILF line(s) of code that are set for trapping will be marked with the red and white icon and the entire line will be have a pink background. The next ILF line to be executed is marked with a blue and white icon and the line will have a blue background. Traps may be set at run time by clicking on the desired line and then clicking on the Trap icon on the Toolbar.
> >
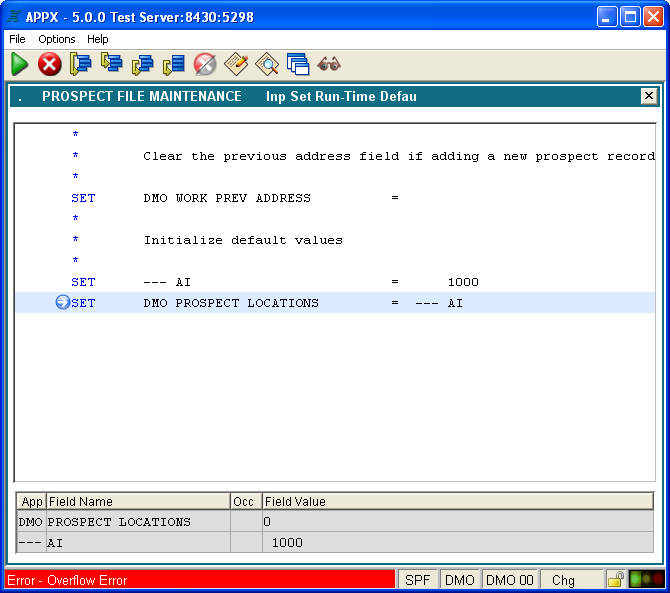
If a runtime error causes the ILF debugger to be invoked, the statement which caused the error will be highlighted with a light blue background color. The next ILF line to be executed is marked with a blue and white icon and the line will have a blue background. The white arrow in the blue circle points to the statement to further hightlight it.