

| I | Attachment | History | Action | Size | Date | Who | Comment |
|---|---|---|---|---|---|---|---|
| |
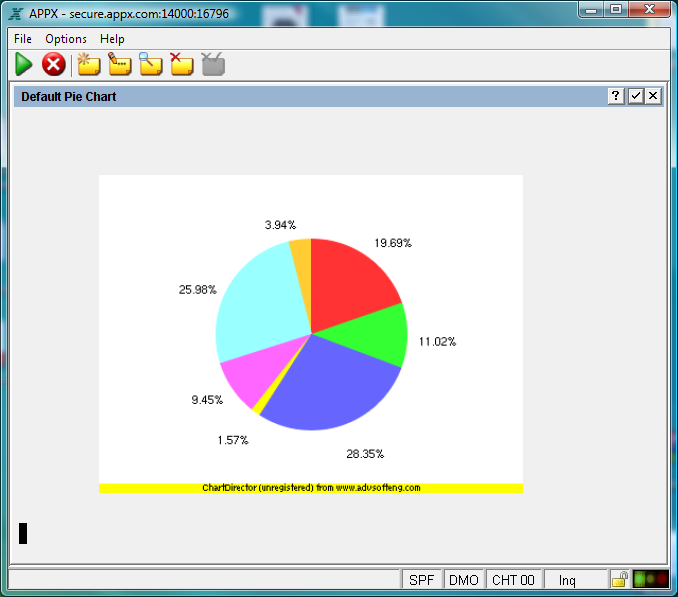
DefaultPieChart.png | r1 | manage | 80.8 K | 2010-04-01 - 20:08 | SteveFrizzell | Default Pie Chart |
| |
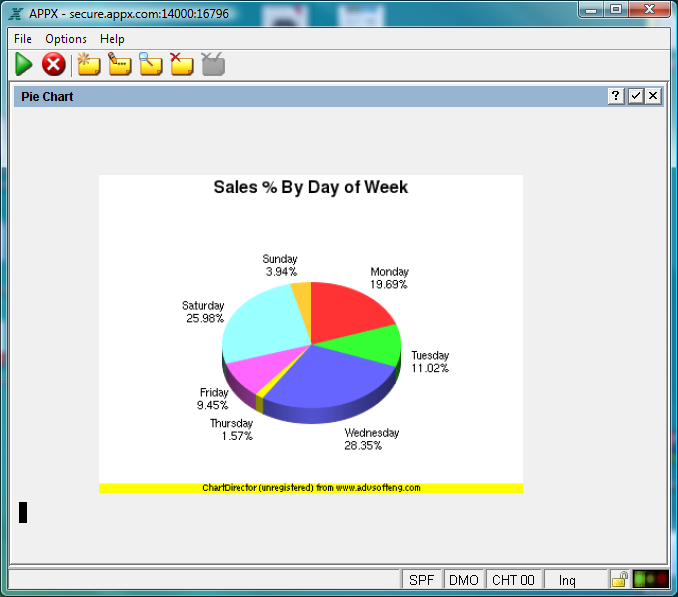
piechart.png | r1 | manage | 89.0 K | 2010-04-01 - 20:13 | SteveFrizzell | Pie Chart |

Ideas, requests, problems regarding TWiki? Send feedback