


Chapter 4-5: The Debugger
Invoking the Debugger
Invoking the ILF debugger involves two steps:
· Using the ILF editor, insert a TRAP statement in the routine you want to test, at the point where you want to enter the debugger. Save the modified ILF routine and exit the editor.
· Invoke the appropriate application menu using the Test Database option in Application Design. Select the option to run the process that includes the ILF routine you want to test. NOTE: you must invoke the application from Application Design. TRAP statements are not intercepted in the end user environment. Depending on the type of process it is, you may also be able to invoke it from the Toolbox during Process Maintenance.
When you execute the process that includes the ILF routine you want to test, APPX encounters the TRAP statement and recognizes that you want to invoke the debugger. At this point, the initial debugger screen displays as shown in Figure 4-5-1 below.
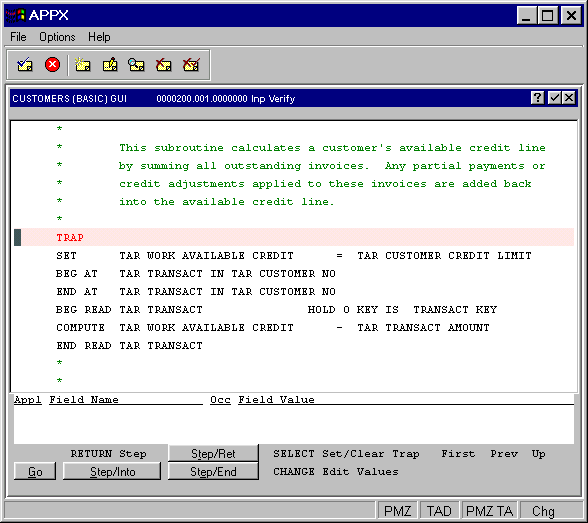
Figure 4-5-1. An Initial Debugger Screen at TRAP Statement
You are now in the debugger, and the cursor is positioned on the TRAP statement line. The TRAP keyword is brightened to indicate that the TRAP is currently active, and you are ready to perform any of the debugging functions.
On some computers, you are able to dynamically enter the debugger by pressing a terminal key, without having to add a TRAP statement as described above. Refer to the installation guide to see if this capability is available on your computer.
APPX Application
Design Manual (01/13/03)
© 2003 by APPX Software, Inc. All rights reserved