Difference: APPXGuiILFDebugger (4 vs. 5)
Revision 52008-09-30 - SteveFrizzell
| Line: 1 to 1 | ||||||||
|---|---|---|---|---|---|---|---|---|
APPX ILF Debugger | ||||||||
| Line: 17 to 17 | ||||||||
 | ||||||||
| Changed: | ||||||||
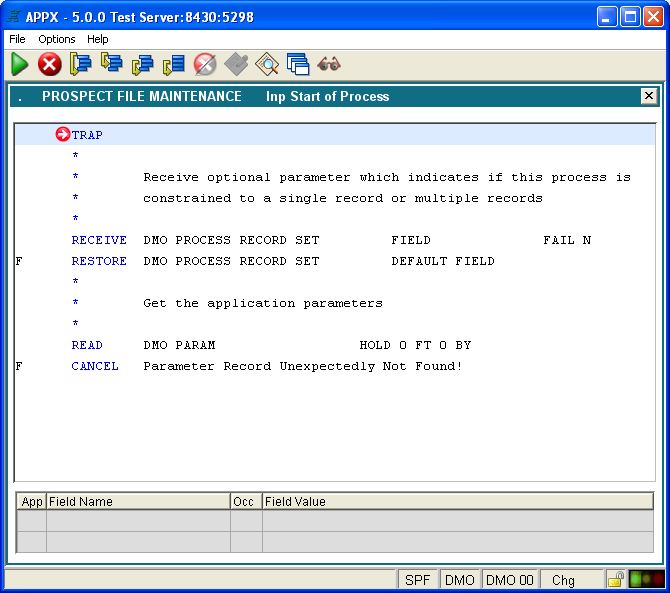
| < < | If a runtime error causes the ILF debugger to be invoked, the statement which caused the error will be highlighted with a light blue background color. The next ILF line to be executed is marked with a blue and white icon and the line will have a blue background. The white arrow in the blue circle points to the statement to further hightlight it. | |||||||
| > > | If a runtime error causes the ILF debugger to be invoked, the statement which caused the error will be highlighted with a light blue background color. The white arrow in the blue circle points to the statement to further hightlight it. In the example below, notice that the value for the fields for the current statement are displayed in the field value window on the bottom of the screen. | |||||||
 | ||||||||
| Changed: | ||||||||
| < < | ||||||||
| > > | The following icons are used to mark ILF statements for the benefit of the application designer: | |||||||
|
| ||||||||
| Line: 29 to 29 | ||||||||
|
| ||||||||
| Changed: | ||||||||
| < < | The Toolbar contains several new icons. The Green Arrow will jump out of the trapped event point . The Red X will cancel the process as always. Single step will execute the next sequential instruction, same a the Return key. The Step Into will follow a child process. Step Return takes you to the next Return statement. There is a red/gray icon you can use to set and remove a trap. F3 can still be used to set and un-set traps as well. The Edit values icon will allow the current field value(s) to be modified. Inspect/Edit will allow you to enter a field and see its contents. View Process Stack will display the current process stack showing the Ap/Ver, Proc Type, Process Name, and invocation share class. Watch Variable allow you enter a field name and Appx will indicate when the contents of that field change. | |||||||
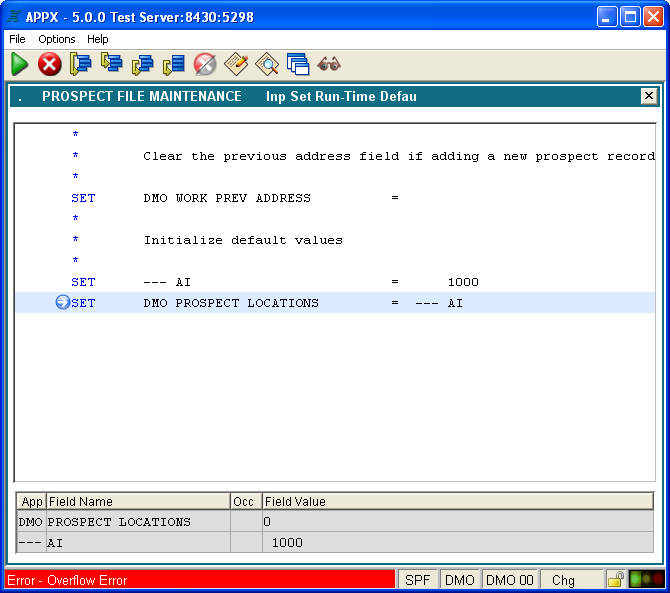
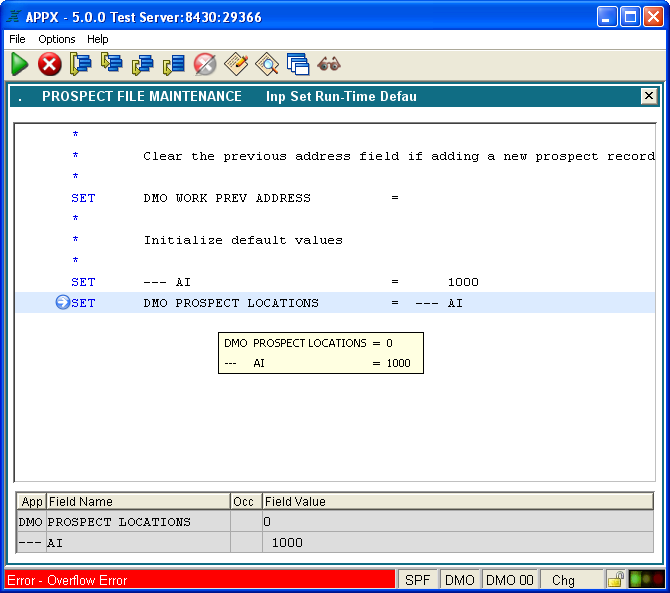
| > > | Field values can also be viewed in a popup tooltip by moving the mouse pointer over any ILF statement which references fields. | |||||||
| Changed: | ||||||||
| < < | Scrolling the ILF Debugger using the up and down arrow keys is not permitted. | |||||||
| > > |  | |||||||
Toolbar Buttons | ||||||||
| Added: | ||||||||
| > > | The Toolbar contains a variety of buttons that facilitate debugging of a process: | |||||||
| Line: 89 to 89 | ||||||||
Comments:Read what other users have said about this page or add your own comments. | ||||||||
| Changed: | ||||||||
| < < | ||||||||
| > > | The toolbar needs a button for: Execute Next [F9] - Set next statement to execute -- SteveFrizzell - 30 Sep 2008 | |||||||
| -- SteveFrizzell - 26 Sep 2008 | ||||||||
| Changed: | ||||||||
| < < | ||||||||
| > > | ||||||||
| ||||||||
| Line: 116 to 119 | ||||||||
| ||||||||
| Added: | ||||||||
| > > |
| |||||||
View topic | History: r7 < r6 < r5 < r4 | More topic actions...
Ideas, requests, problems regarding TWiki? Send feedback